
You take charge of a real country. You set its taxes and its budget, you form its government, you put your laws to the vote, and the economy and public opinion answer you day after day.
- Genre
- Geopolitical and macroeconomic simulator
- Studio
- Epure Works
- Platform
- Windows
- Languages
- French, English, Spanish, German
- World
- 240 countries, their regions and their provinces
- Time
- Day by day, with pause and four speeds
The map
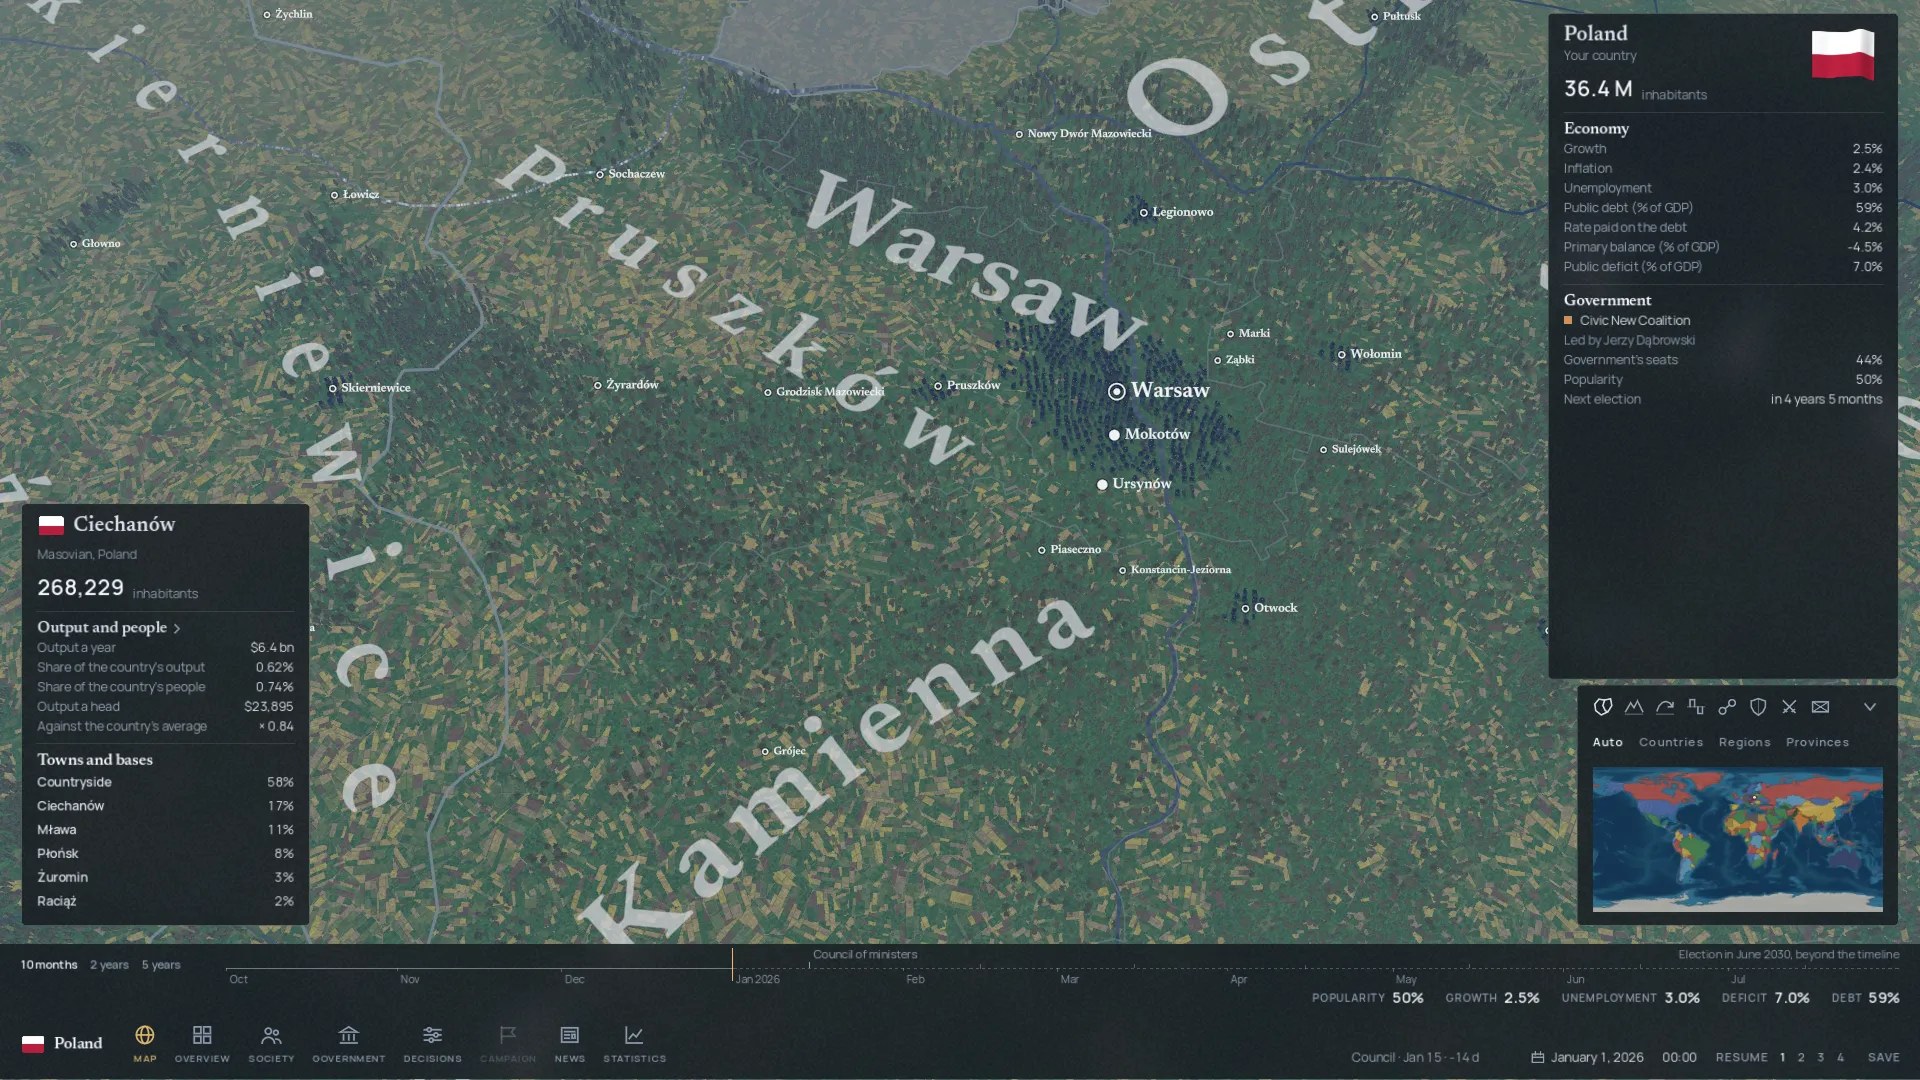
The whole world is on the map, and the zoom goes down from the country to the region, then to the province and the city, all the way to the fields and forests. Each province has its panel, with its inhabitants, what it produces, its share of the country, and how its output is split between its countryside, its cities and its bases. A country's panel sums up its economy and its government.
The bottom bar keeps the popularity, growth, unemployment, deficit and debt of the country you play in view. A timeline on it shows the months ahead, with the next council of ministers, the votes to come and the elections, and the bar is also where time is paused or sped up.
The area around Warsaw, with the panel of the province of Ciechanów on the left and that of Poland, the country being played, on the right.
The data
Every country starts the game with its real figures. Output, prices and unemployment come from the World Bank, year by year since 2000, and each state's budget is split into eight spending lines and fifteen taxes.
- Simulated countries
- 240
- Regions
- 1,957
- Provinces
- 10,458
- Parties
- 1,172
- Political figures
- 17,577
- Documented equations
- 35
Society
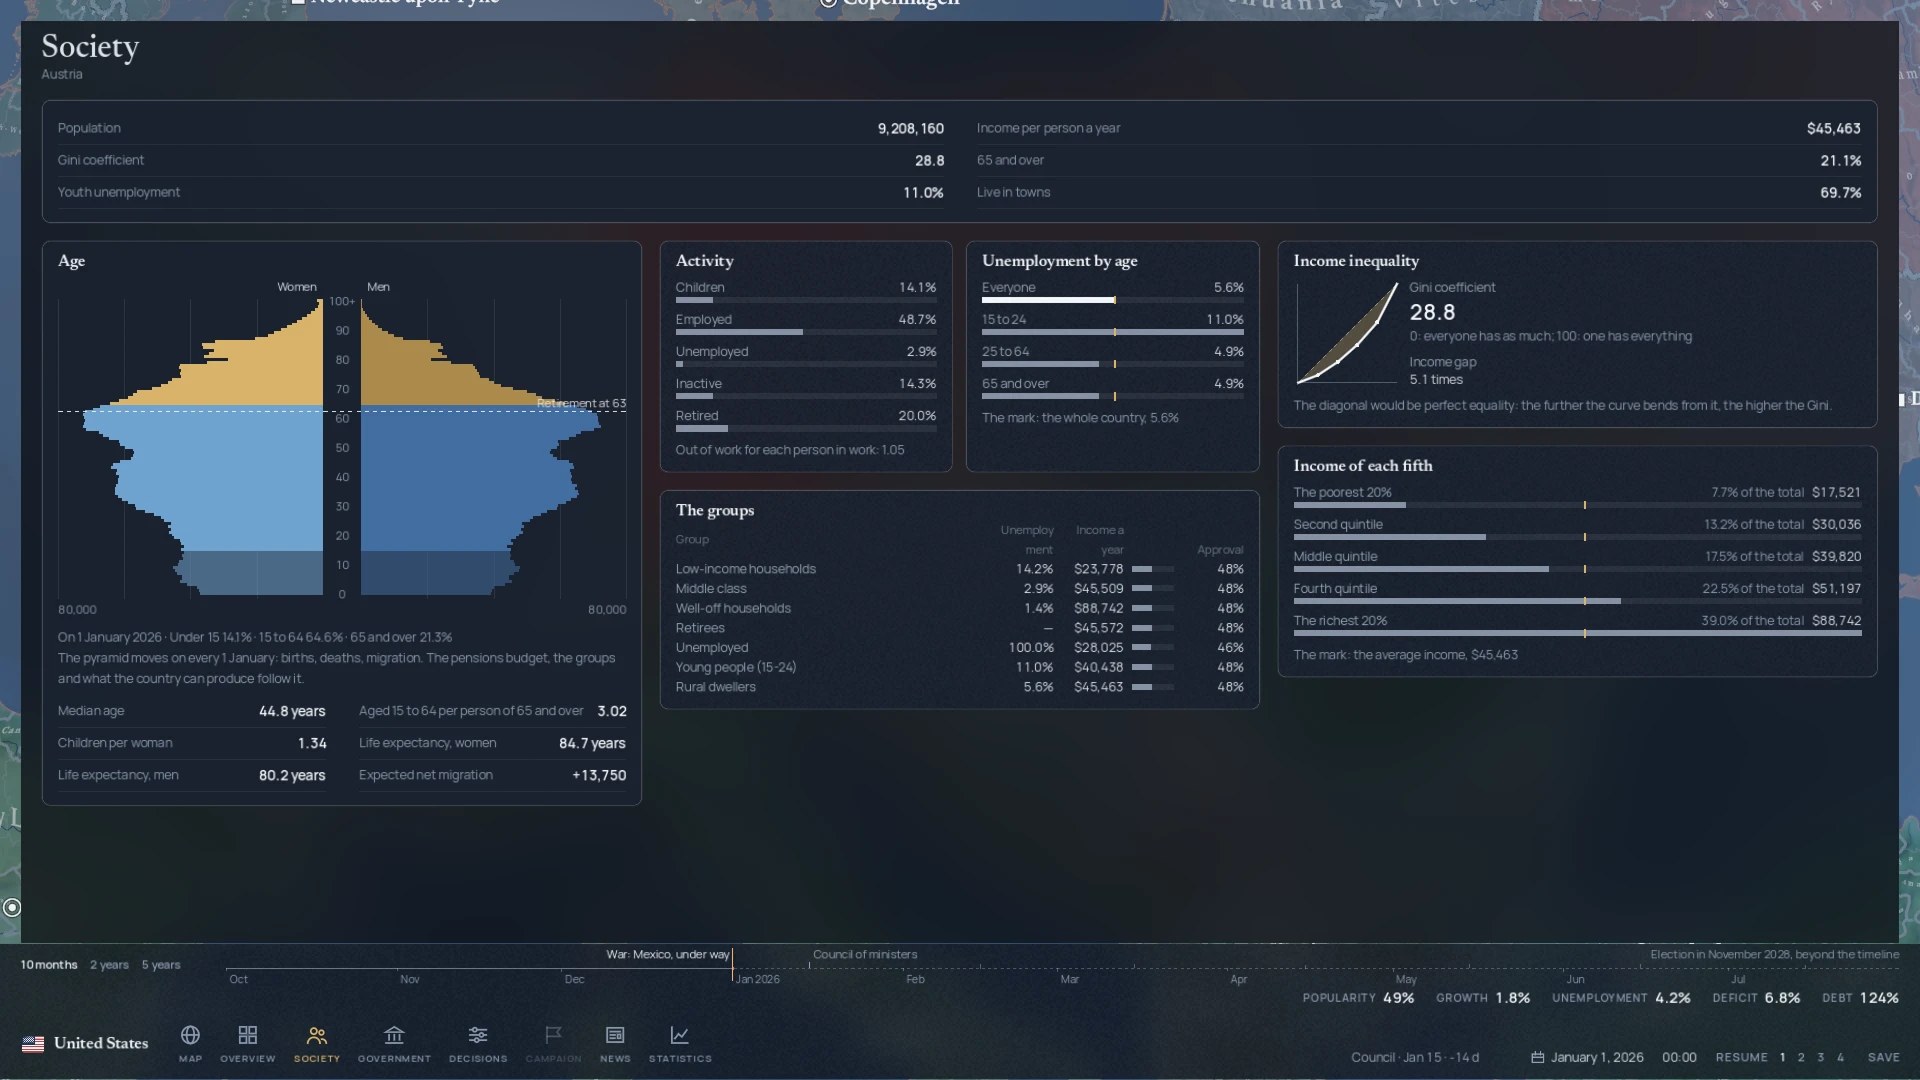
This screen describes the people of a country, yours or any other. The age pyramid moves on 1 January each year with births, deaths and migration, and the retirement age is marked on it. Alongside it come activity, unemployment by age, the inequality curve with the Gini coefficient, and the income of each fifth of the population.
The seven groups the game follows, from low-income households to rural dwellers, each have their own unemployment, income and opinion of the government here. They are the ones who vote, and the ones who take to the streets when a decision leaves them poorer.
Austria on 1 January 2026, seen from a game played as the United States.
The overview
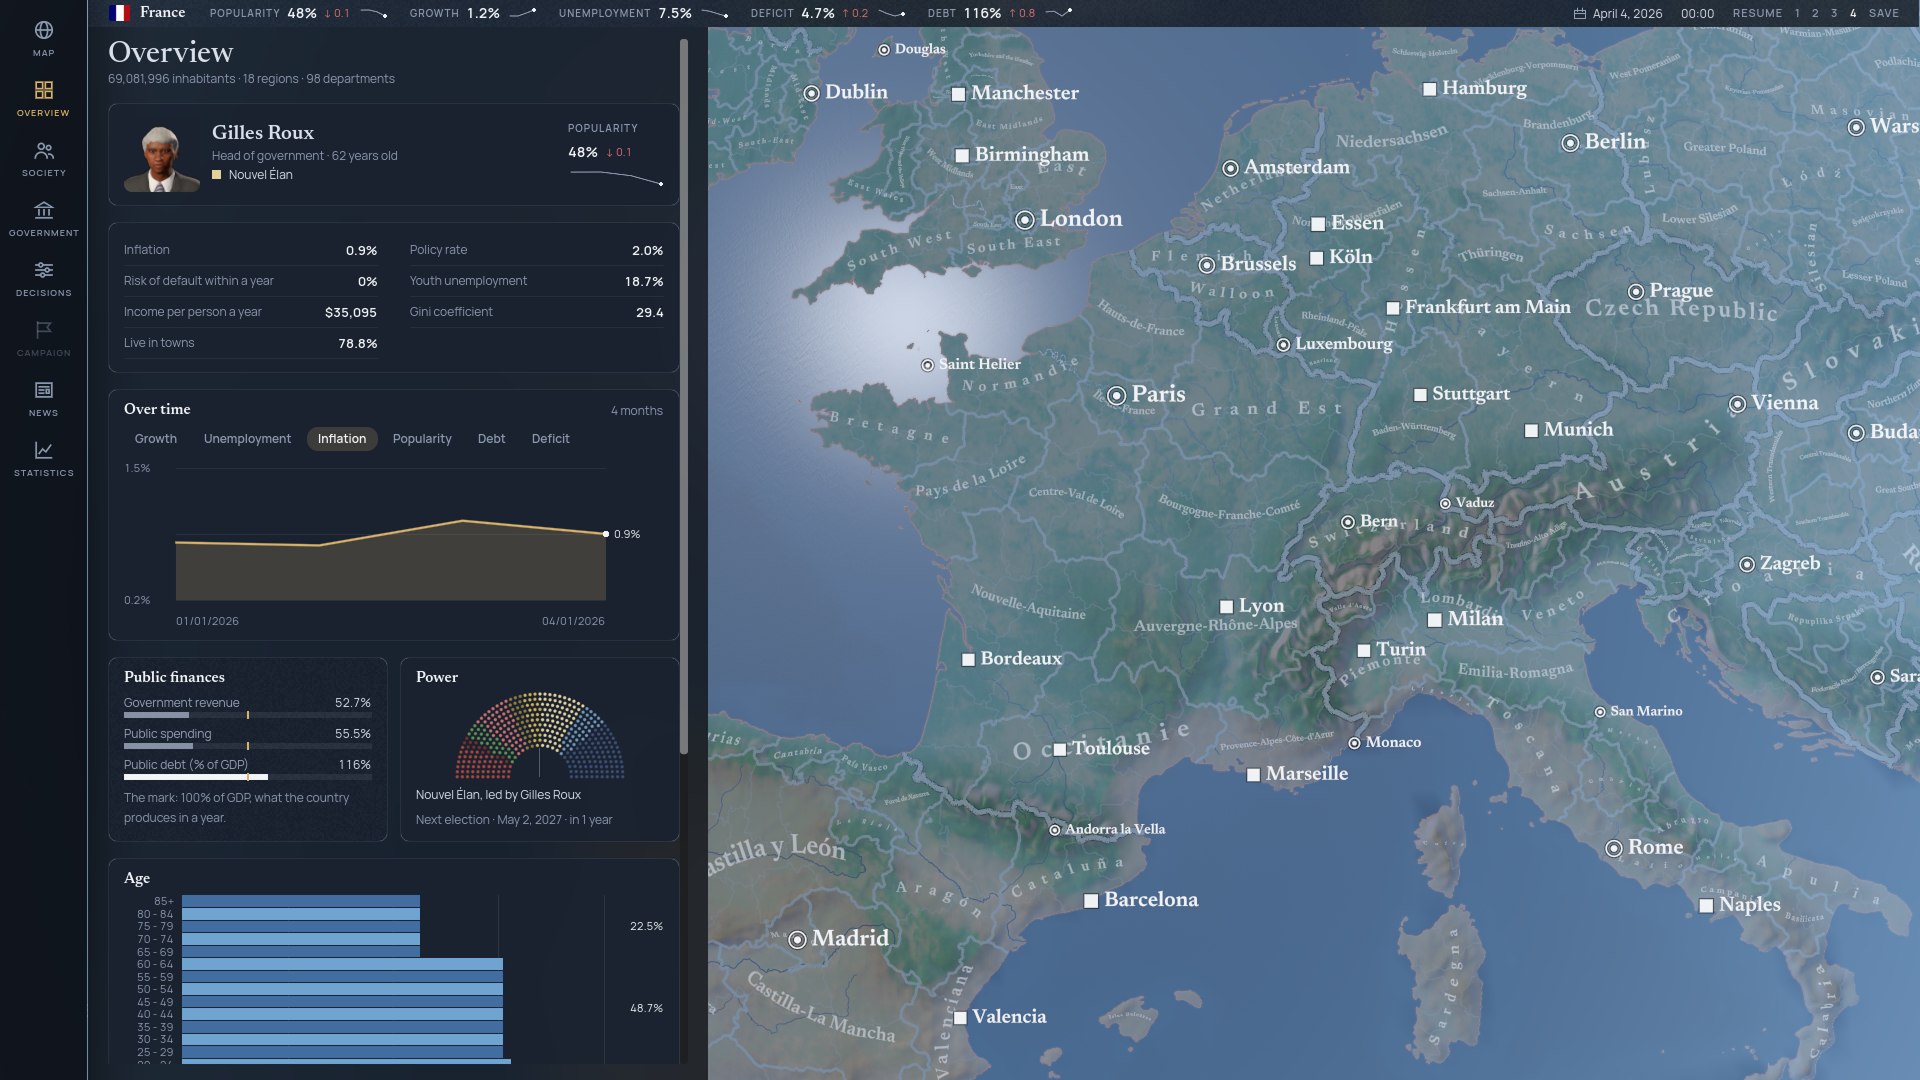
This screen gathers the state of the country. It shows inflation, the policy rate, income per person, youth unemployment or the risk of default, and a curve follows growth, unemployment, inflation, popularity, debt and the deficit over time.
Further down come the public finances, the make-up of the chamber, the date of the next election and the age pyramid.
France on 4 April 2026, with the inflation curve over four months.
The government
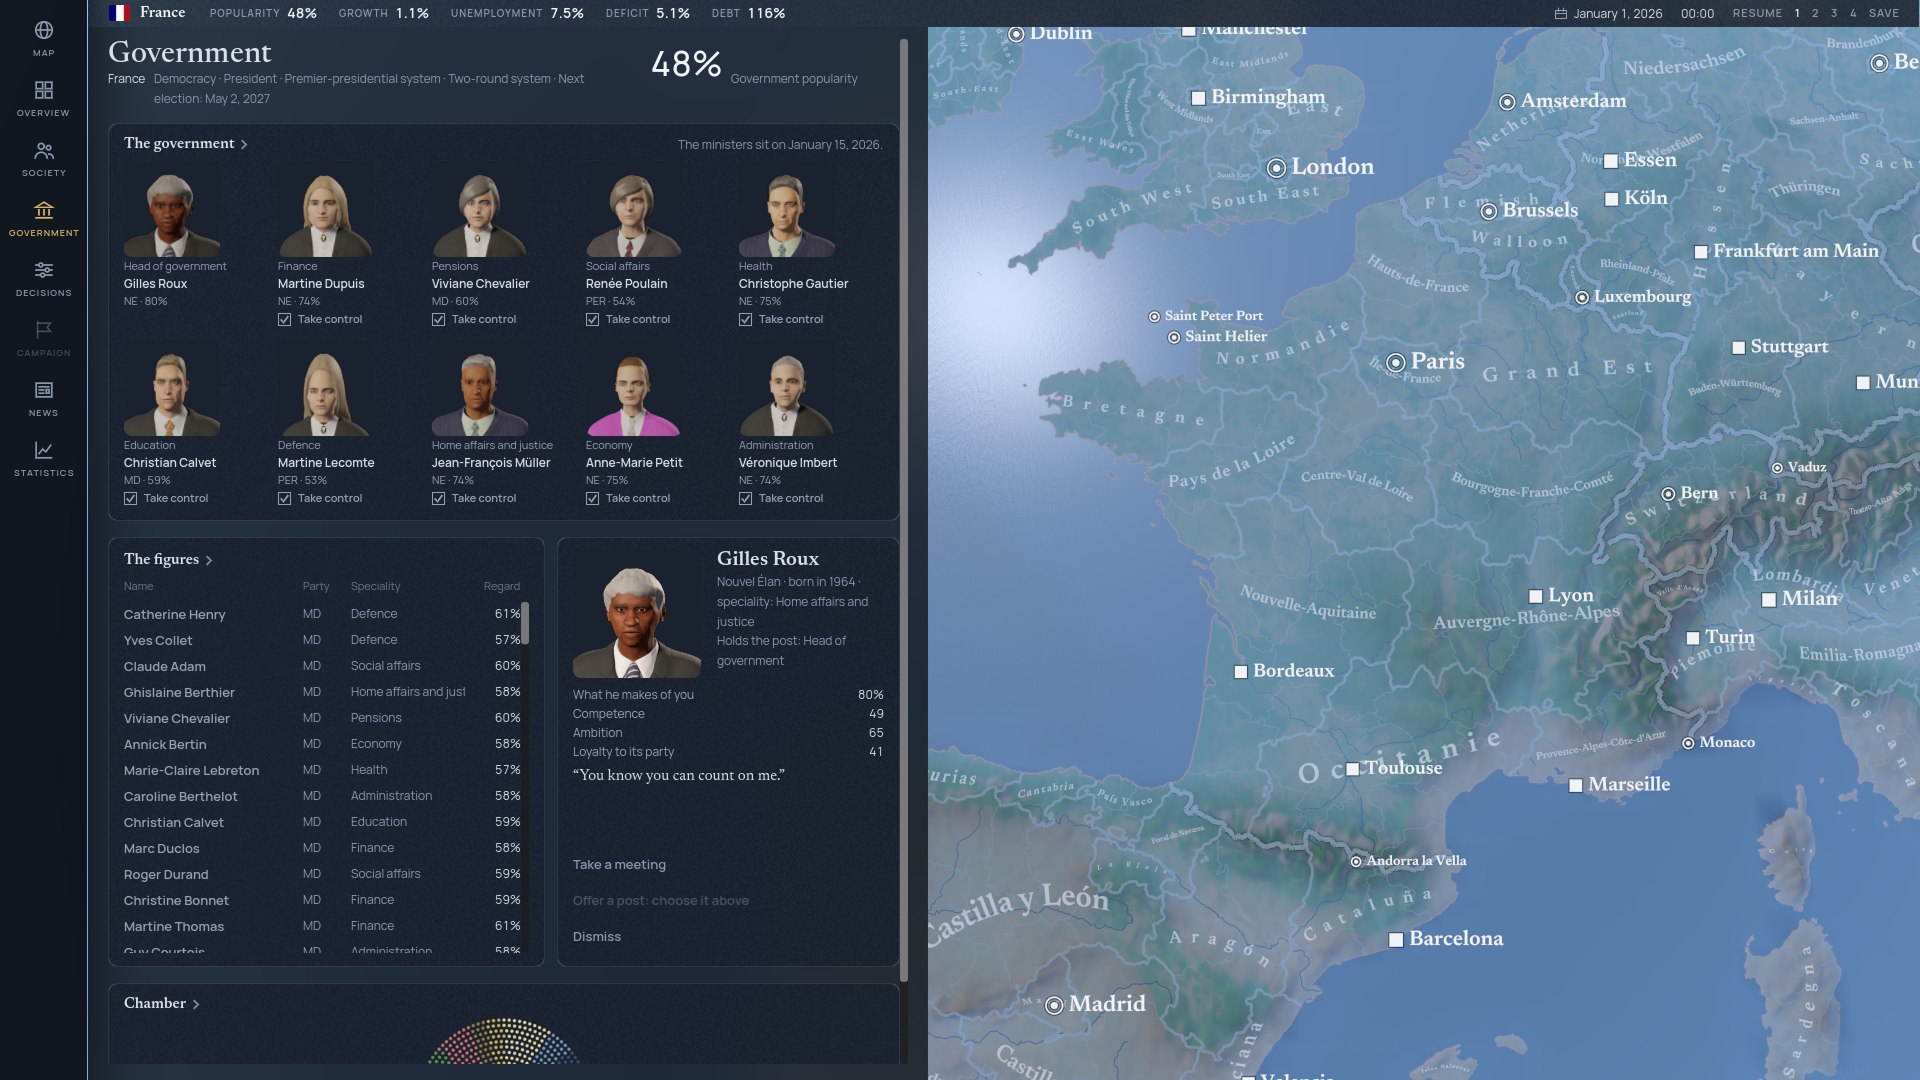
The government is made of people. Each minister has a party, a competence, an ambition and a loyalty to their camp, and their sheet says what they make of you.
You choose who holds each portfolio. You can take a meeting with a figure, offer them a post or dismiss them. A checkbox settles, post by post, who decides. Ticked, you do, and unticked, the minister decides for their ministry.
The ten posts of the French government, the country's figures and the sheet of the head of government.
The decisions
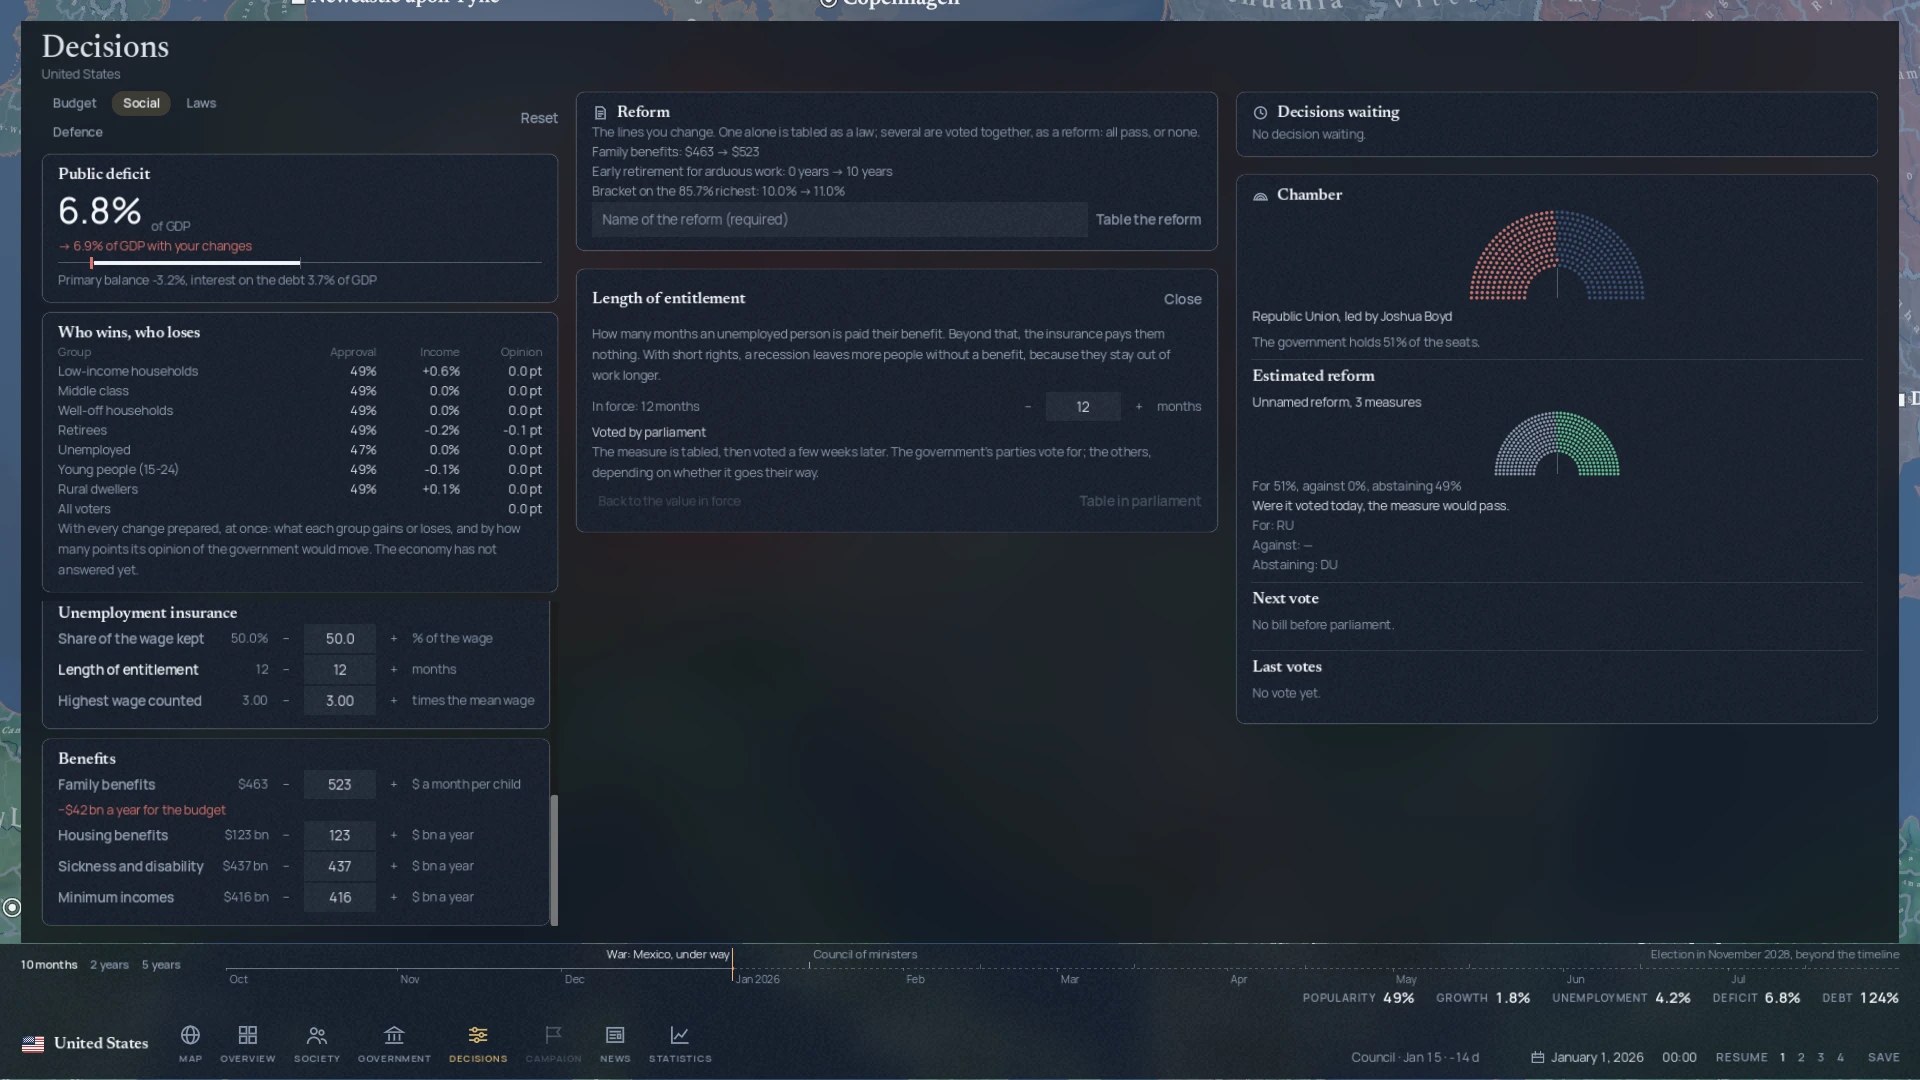
Decisions are sorted into four tabs, for the budget, social policy, laws and defence. Each tax has its rate, from income tax to customs duties by way of the four VAT rates, and each spending line has its share of the budget. The Social tab is where you set unemployment insurance, with the share of the wage it keeps, the length of entitlement and the highest wage it counts, along with each of the benefits, such as family benefits per child and per month.
As soon as a line moves, the game shows what it costs, what becomes of the deficit and what each group gains or loses from it, in income and in opinion. A single line is tabled as a law, whereas several are voted on together as a reform, which passes in full or not at all. Before tabling it, you see the estimated vote, with the parties that support it, those that oppose it and those that abstain.
A three-measure reform in the United States, including a rise in family benefits from $463 to $523 a month per child, with its effect on the deficit and the estimated vote.
The vote
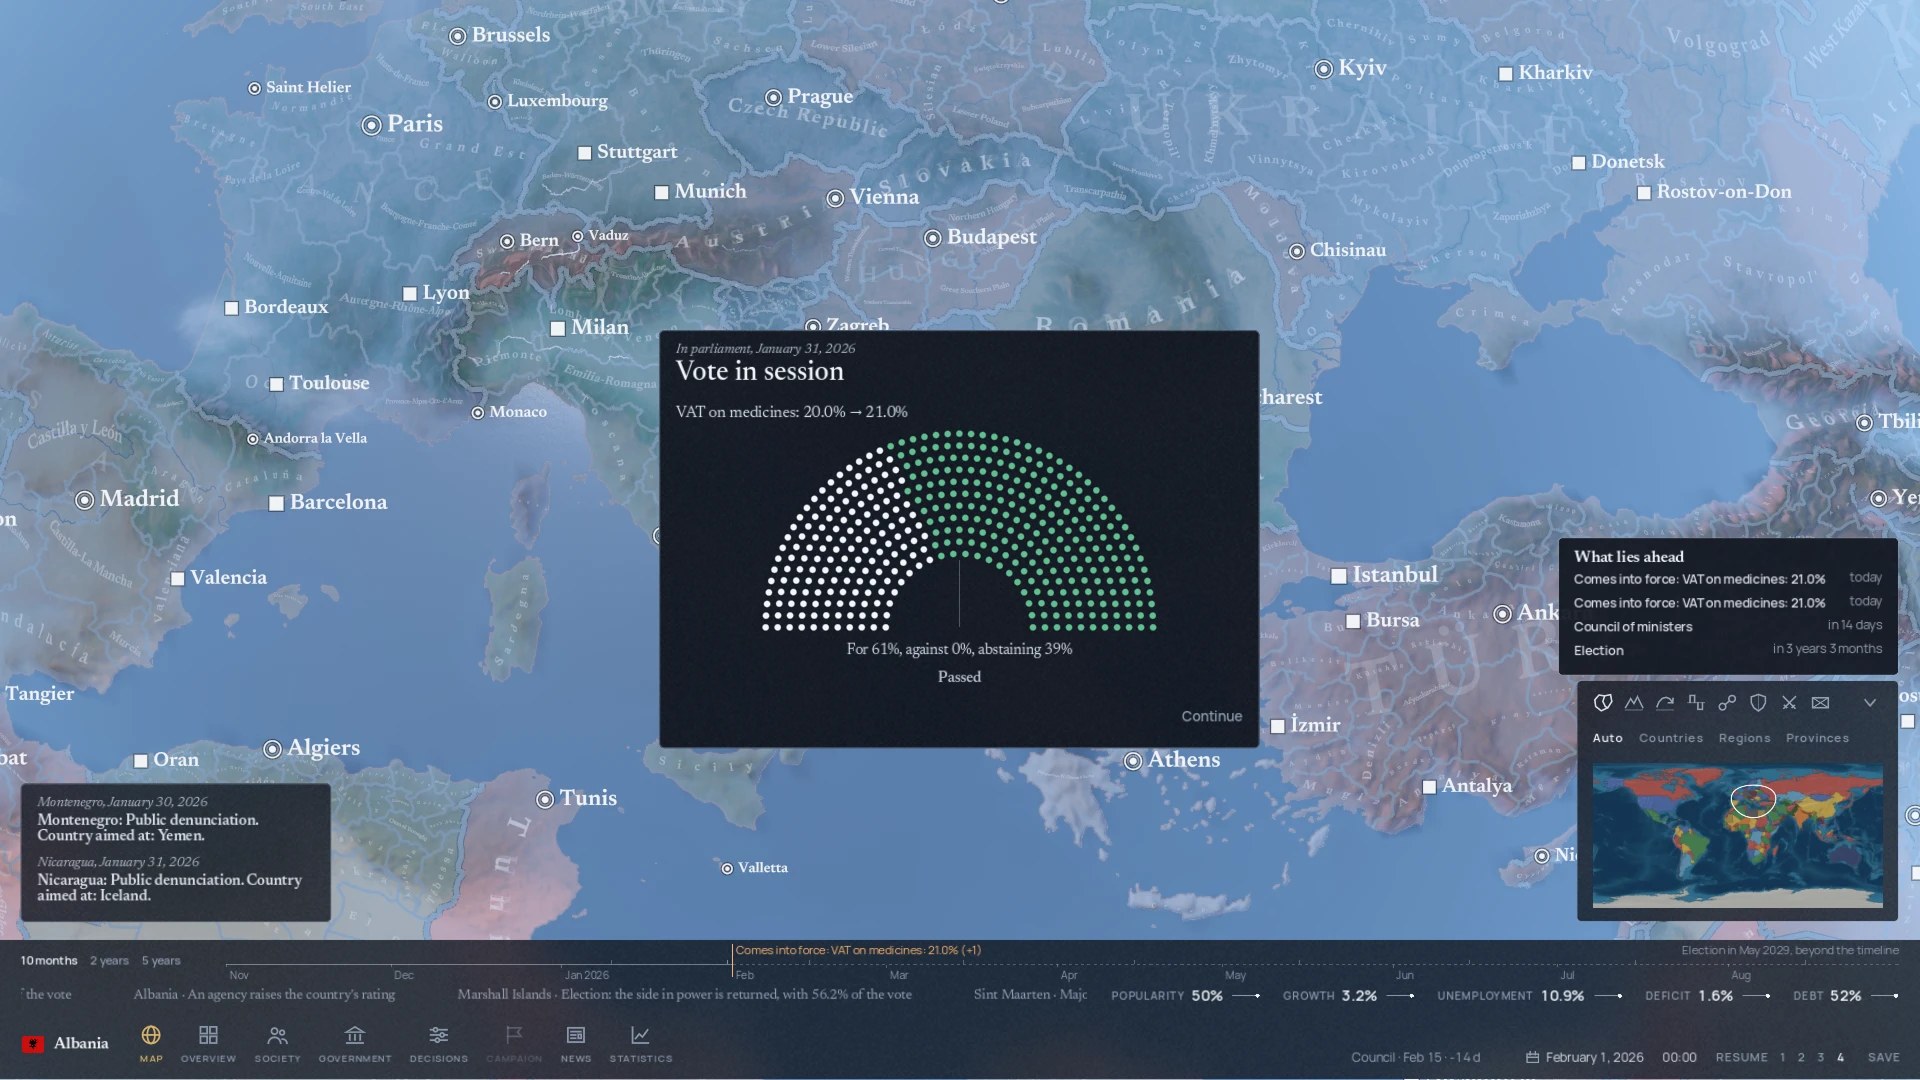
A tabled measure waits for its vote, which in a democracy takes place a month later. On the day, a window shows the chamber, where each seat takes the colour of its vote, and says whether the measure passes. Once passed, it applies from the 1st of the following month.
Each party votes according to what the measure offers it in the light of its ideas. Its vote can still shift a little on the day itself, so a party on the verge of switching stays uncertain to the end, while the others vote as expected.
In Albania, the VAT rate on medicines goes from 20% to 21%, with 61% of the seats for and 39% abstaining.
Events
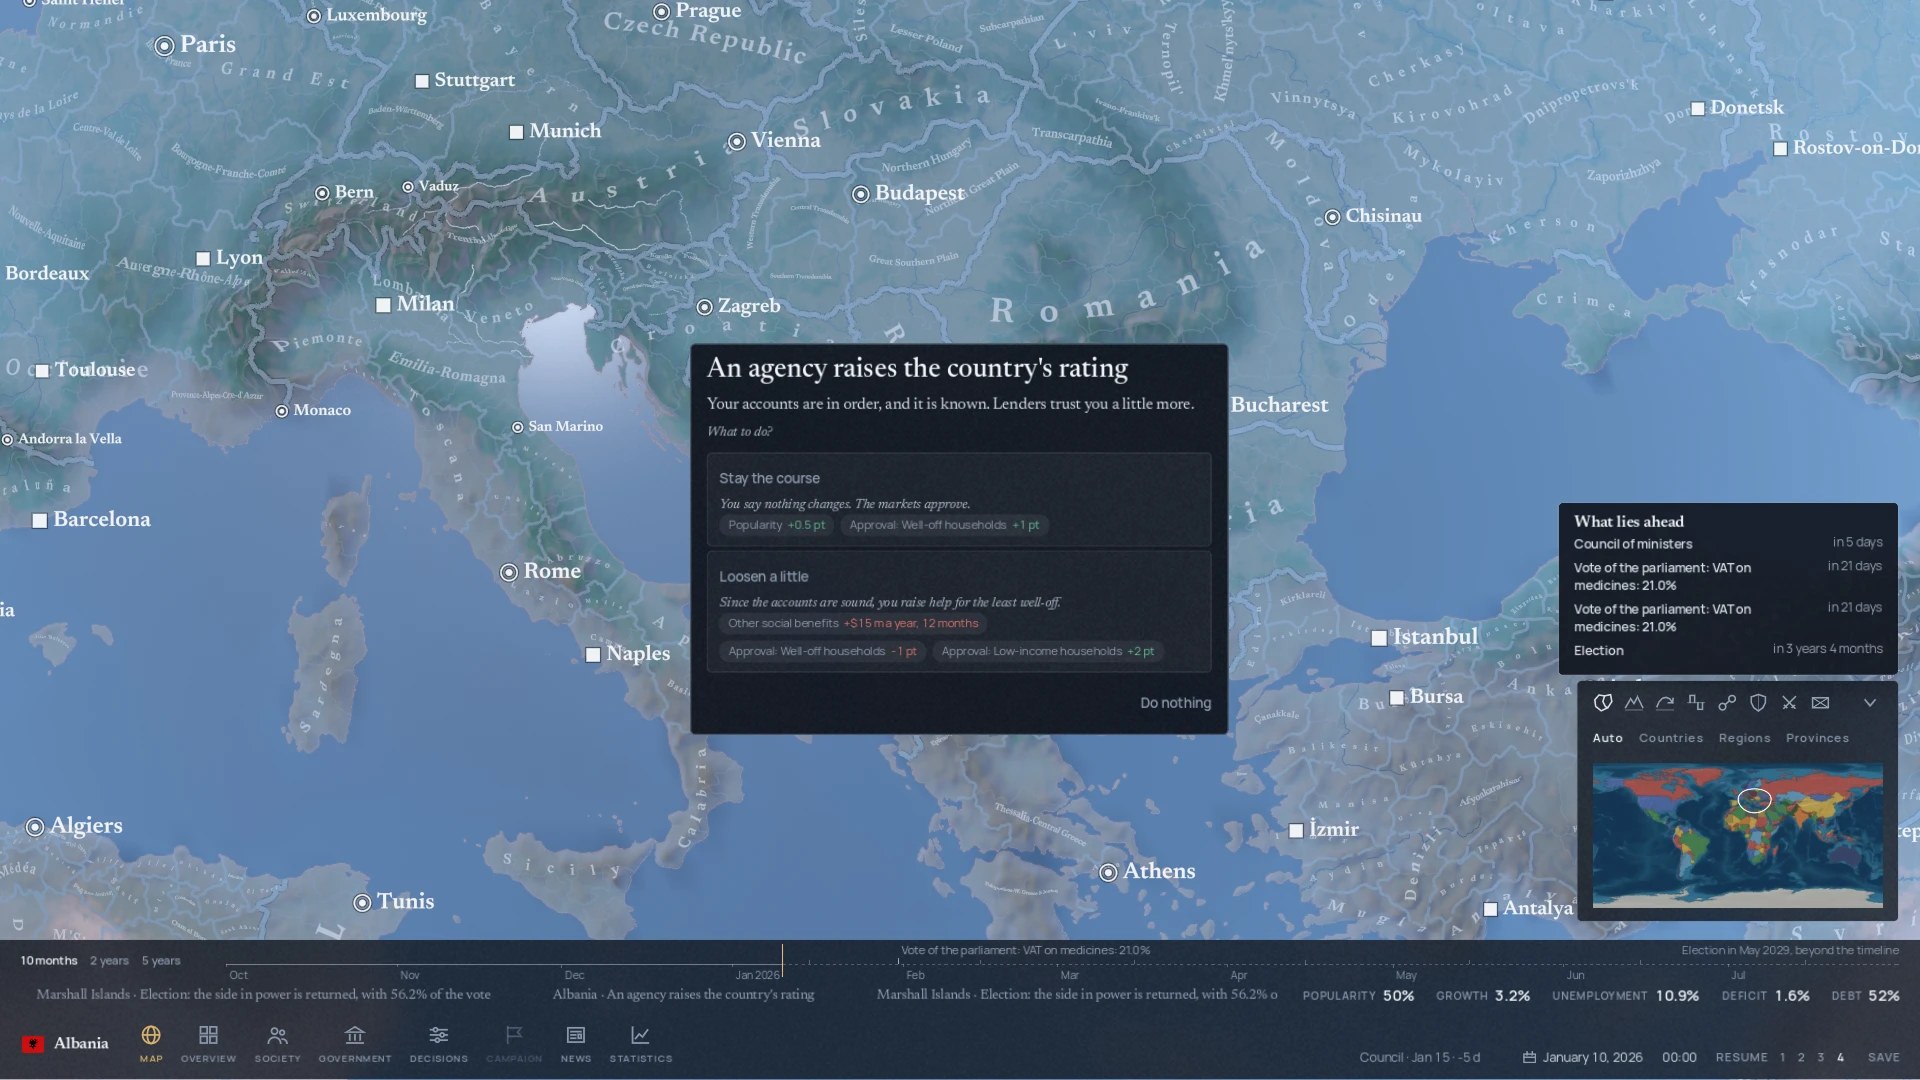
Events land on the player's desk, such as a factory that closes, a bank that wobbles or an agency that raises the country's rating. Each one opens with its responses, and each response says in advance what it does to popularity, to a group's opinion or to a line of the budget.
They only come where the country's figures lend themselves to it, one at a time, and never the same one twice in a row. The world has its own as well, such as a pandemic, an El Niño episode or an earthquake, which strike player and non-player countries alike.
An agency raises Albania's rating, and the player chooses between staying the course and loosening the budget a little.
The monthly report
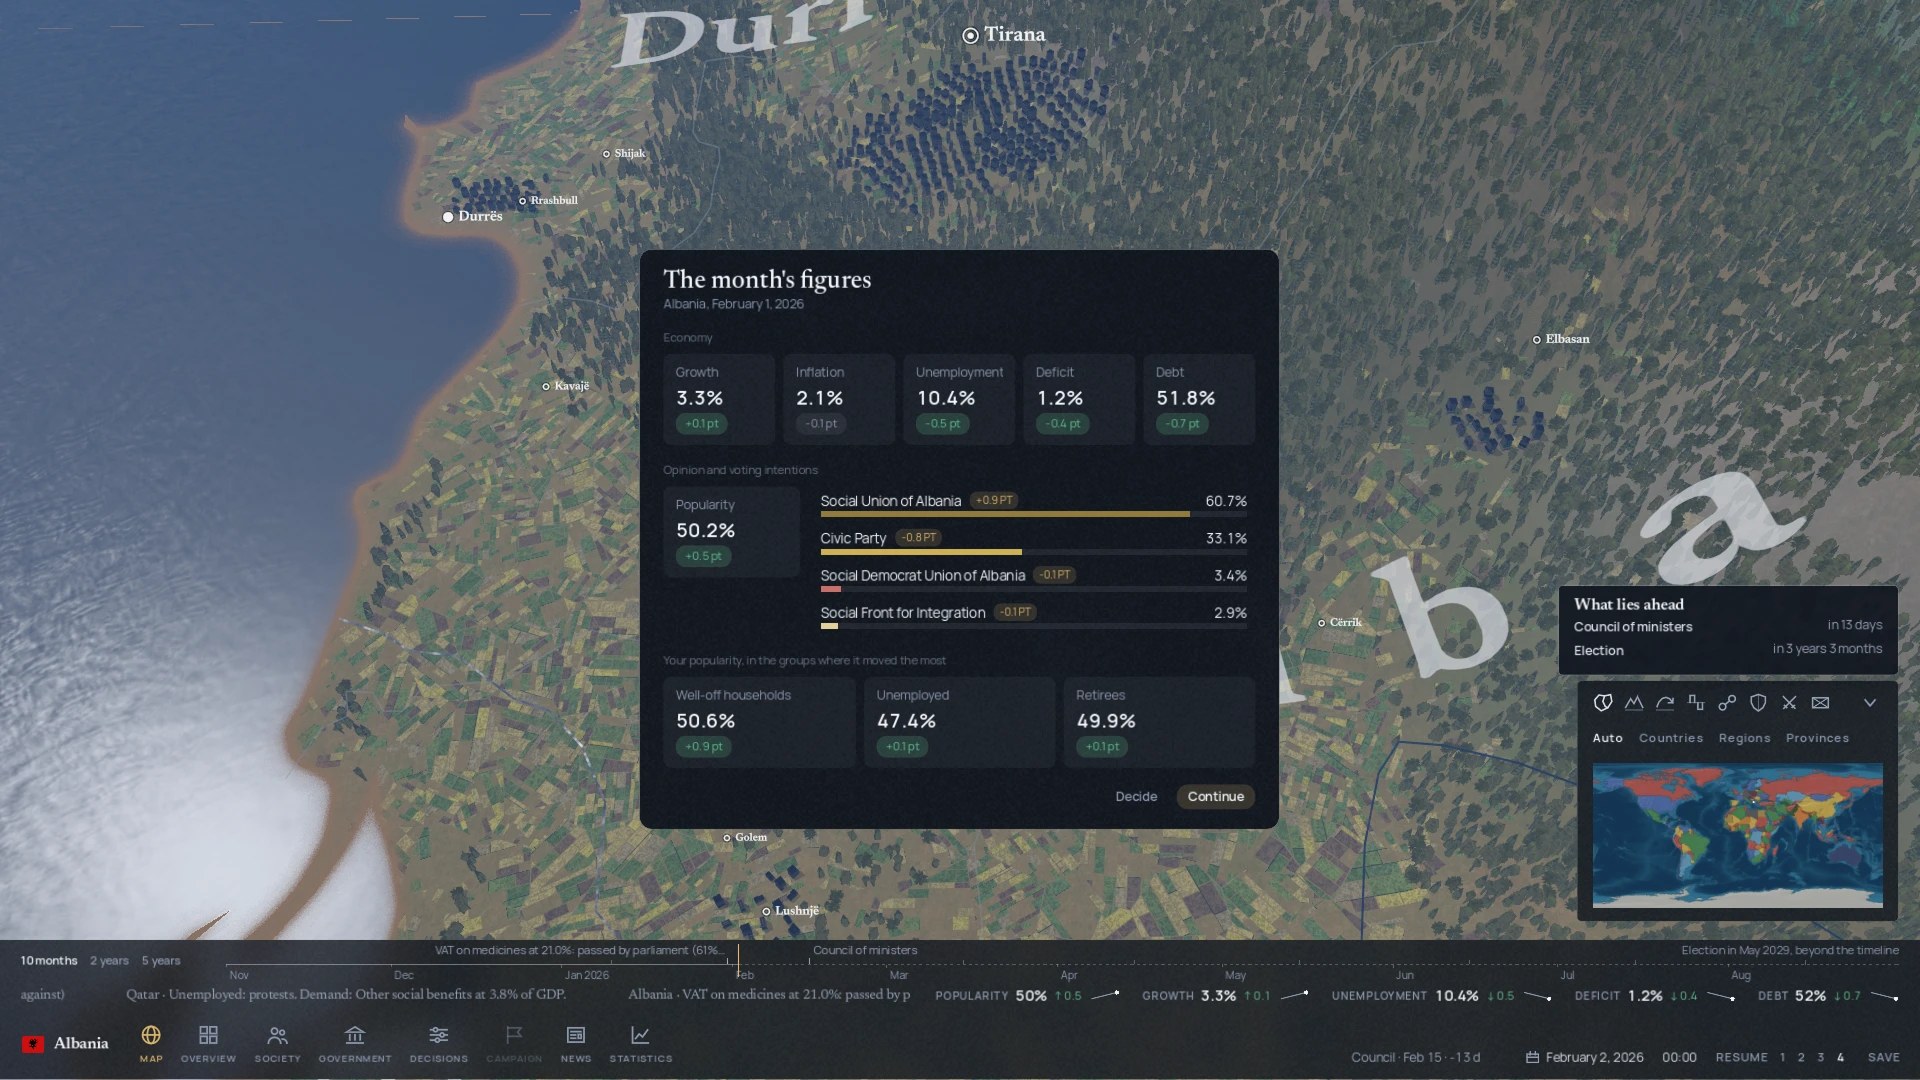
The world moves forward one day at a time, but its statistics are published once a month, on the 1st, as a statistics office would publish them. A report then sums up the month just gone. It gives growth, inflation, unemployment, the deficit and the debt with their change from the previous month, popularity and each party's standing in the polls, and the groups where your popularity has moved most.
Until the next 1st, these are the figures you read. What is decided or signed, on the other hand, whether a law, a treaty or a vote, shows on the very day.
Albania on 1 February 2026, with the coast at Durrës and the forests around Tirana.
Diplomacy
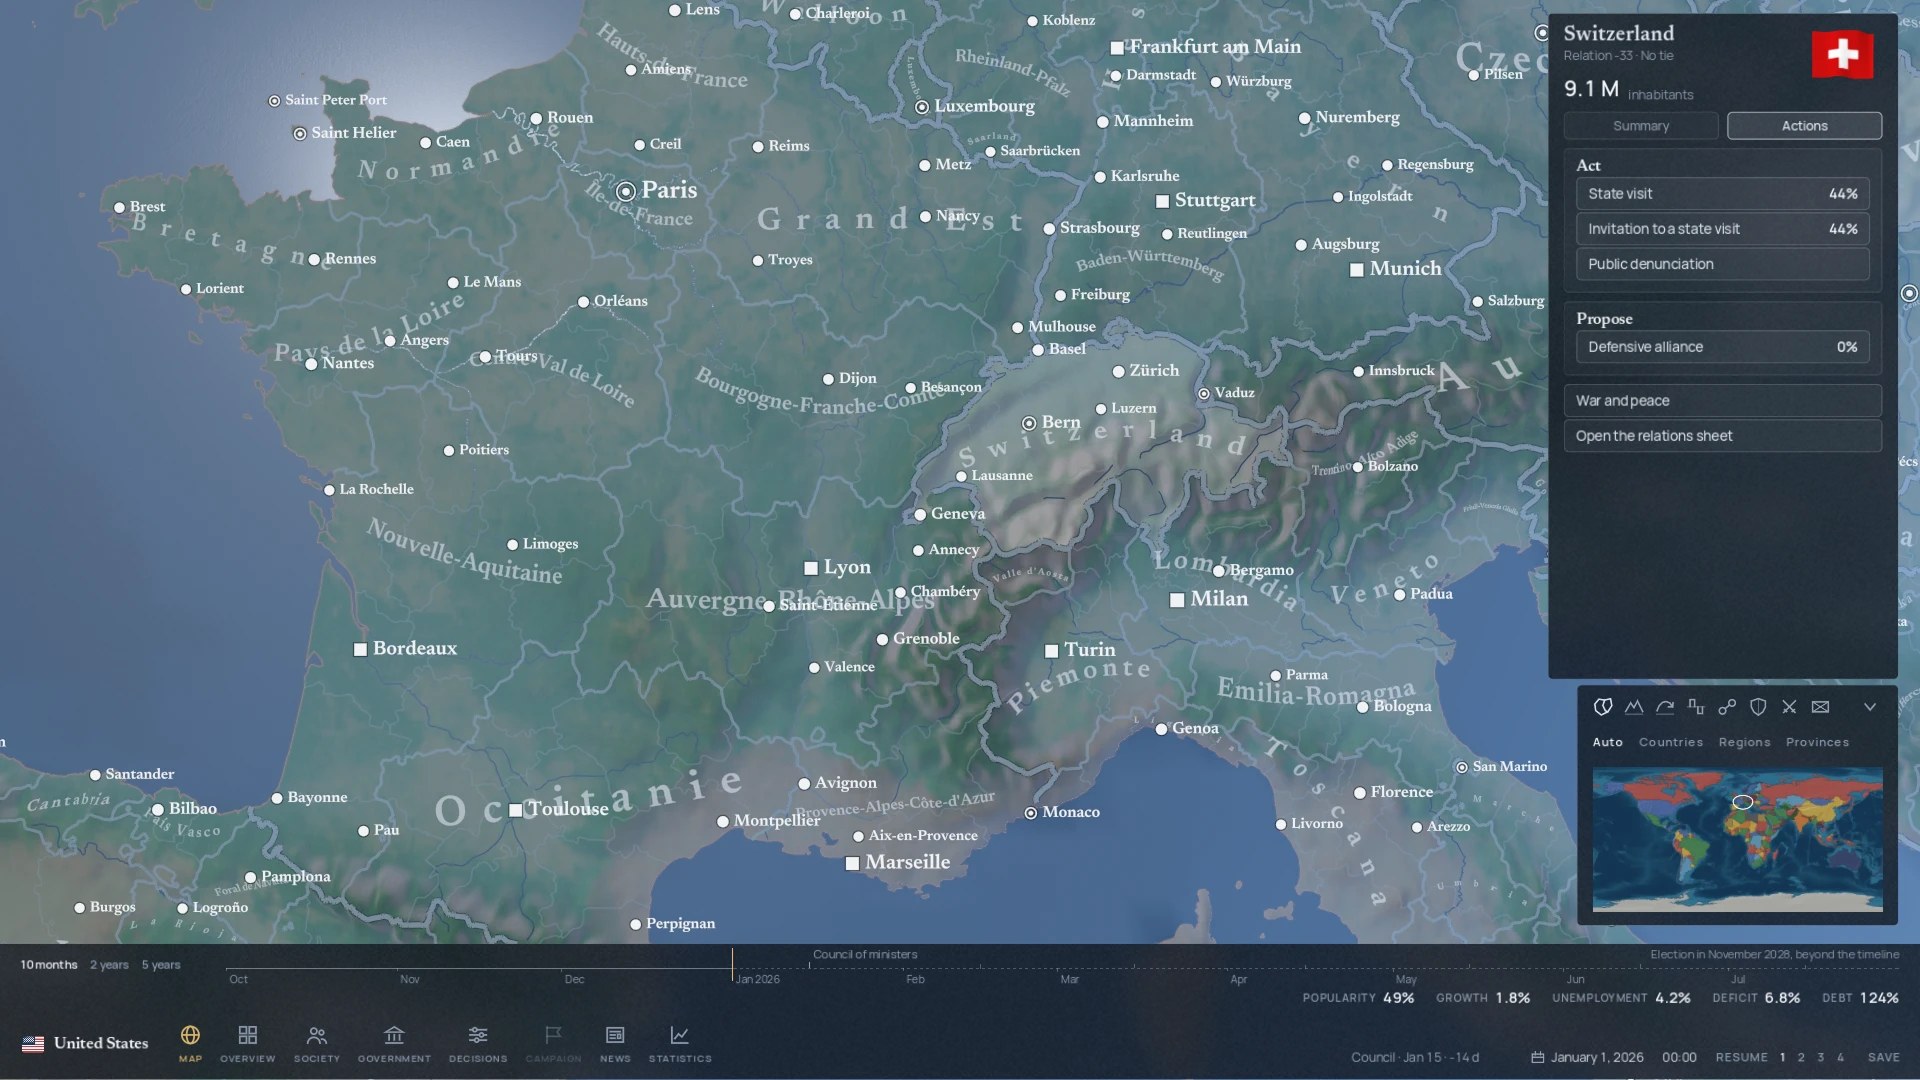
Every country has a relation with yours, from −100 to +100, which the game recalculates from everything that shapes it, from votes at the United Nations and the parties in power to past conflicts, treaties, customs duties and what the two countries have done to each other. One map mode colours each country by its relation with yours, and another by what binds you.
Right-clicking a country opens its actions. From there you pay a state visit, extend an invitation or issue a public denunciation, or propose a treaty such as a defensive alliance, and each line shows the chance that the other country will accept. War and peace are decided in the same place.
Switzerland seen from the United States, with a relation of −33 and the actions the player can take or propose.
War
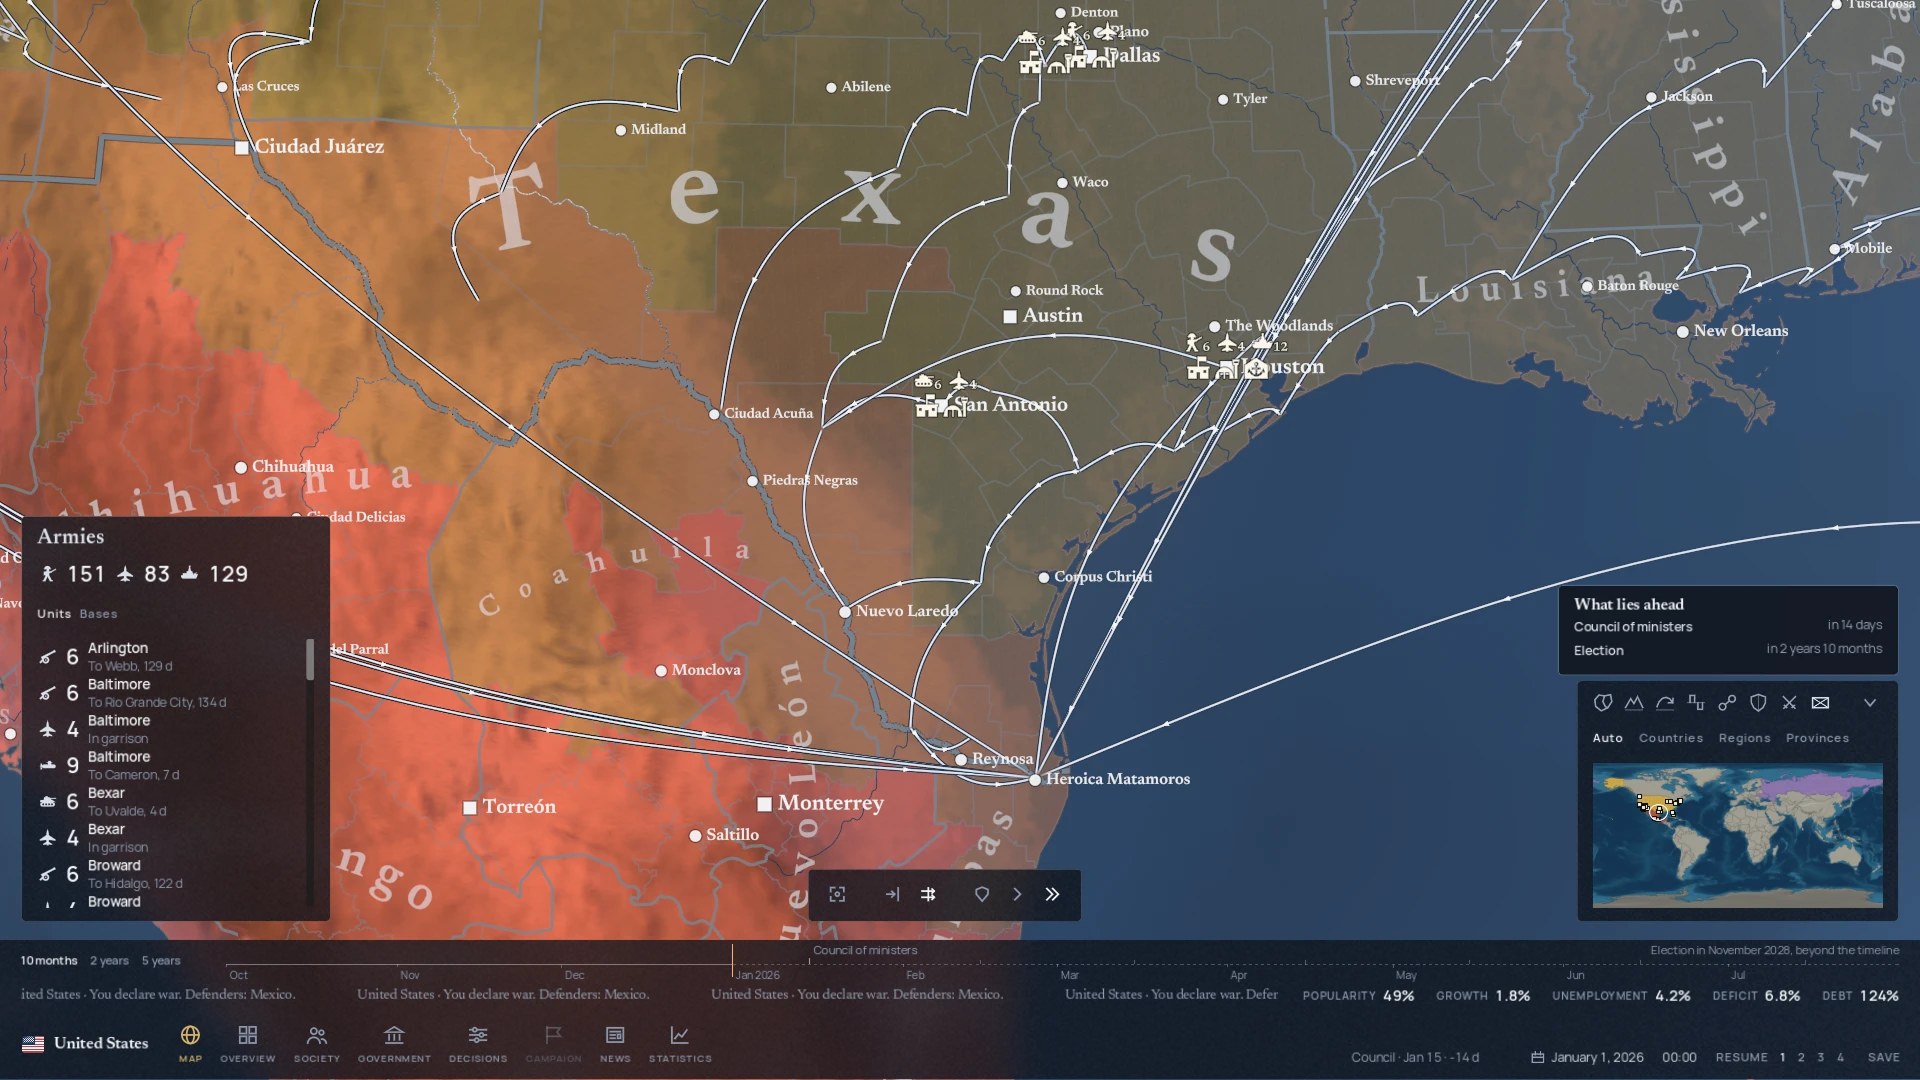
A war is fought with what defence spending has bought. Units on land, in the air and at sea move from province to province in days of marching, and a province falls one place at a time (its countryside, its cities and its bases) when it is pressed harder than it is held. You send your units yourself, or you let your army lead the front.
Each day at the front costs both sides soldiers and equipment, drives away the people who live where it passes and makes the debt more expensive. A war ends in a peace, whose terms the side ahead pays for out of its score, or in an armistice that freezes the front where it stands.
The United States at war with Mexico, with the roster of units, their destinations and the days they have left, and their routes to the border.
Migration
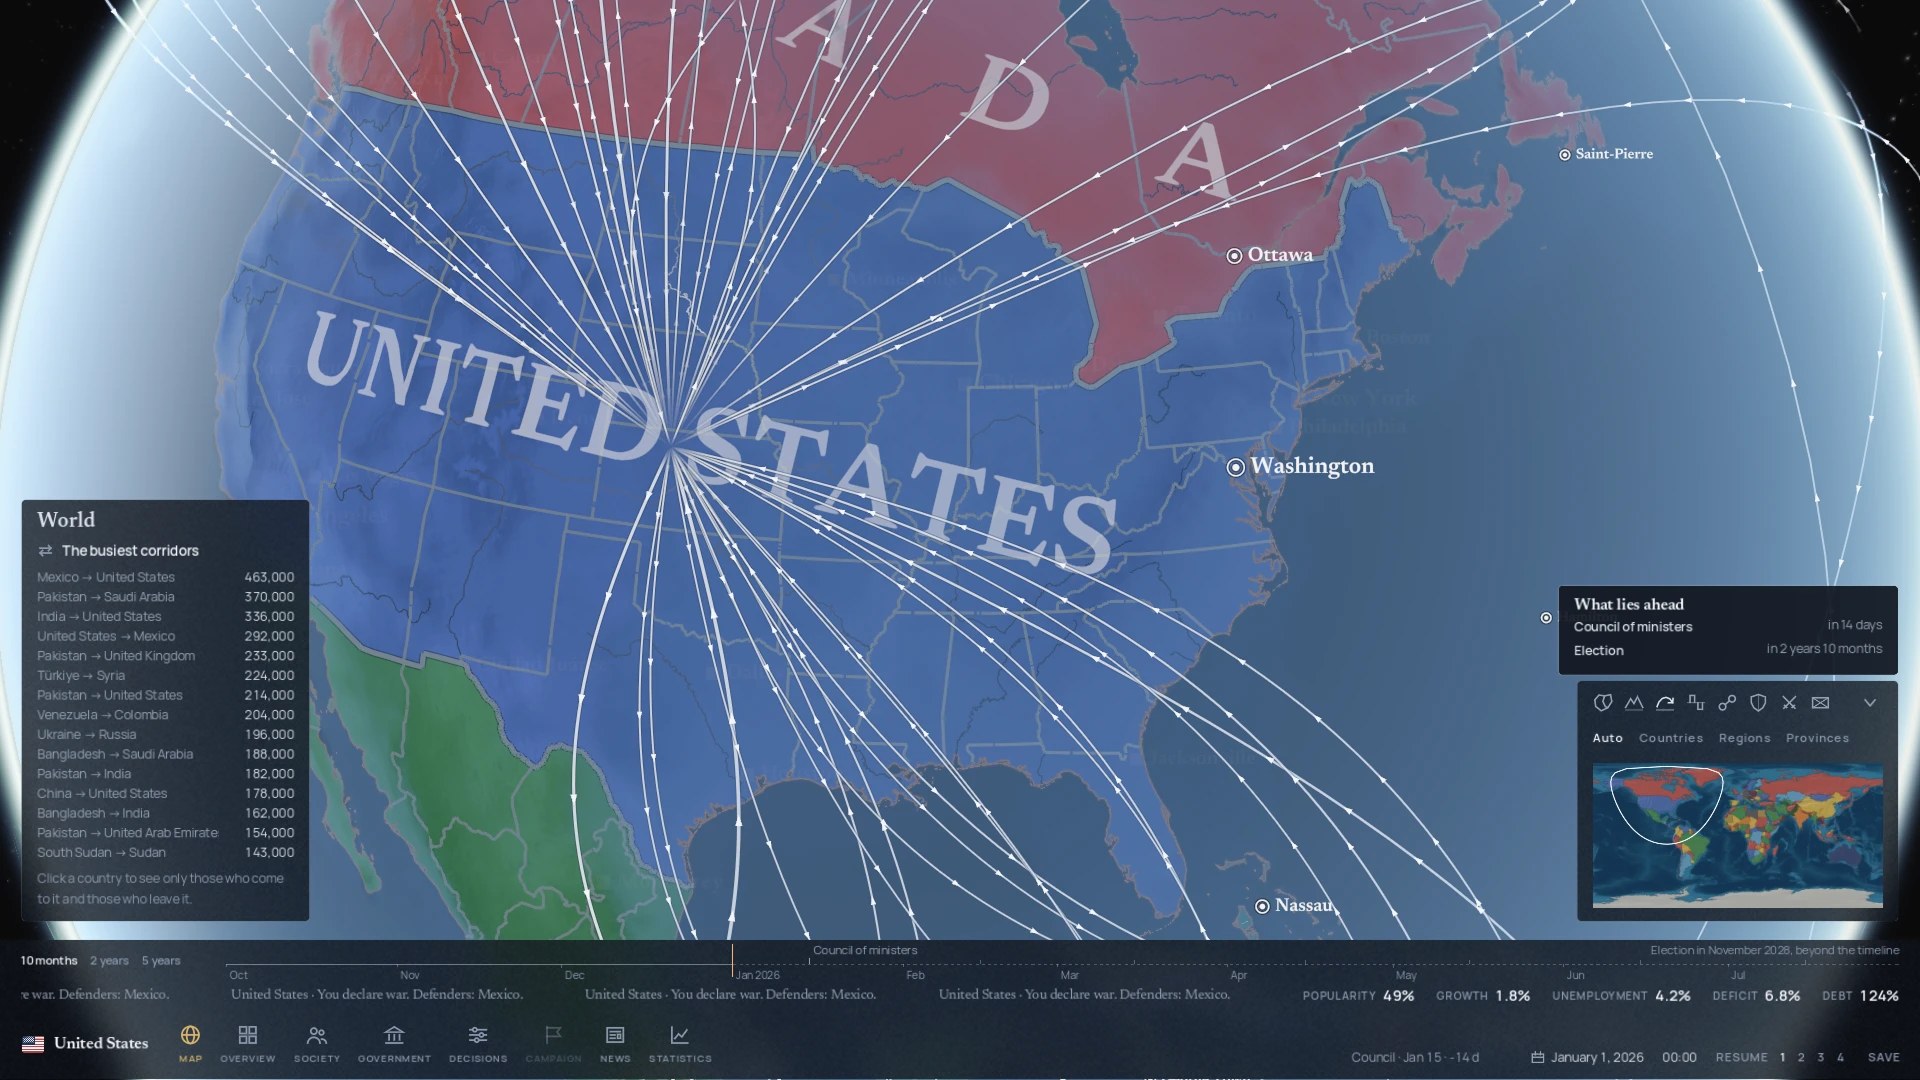
Routes link countries in pairs, and each one says how many people go from one to the other in a year. Every 1 January, the year's departures are calculated from what the countries have become in the game (their income, unemployment, unrest and wars) and from each country's laws on entry, asylum and exit.
A map mode draws these routes. Over the whole world it shows the busiest ones, and for a chosen country it keeps only the people who come to it and those who leave it.
The routes that lead to the United States, with the busiest corridors in the world.
The statistics
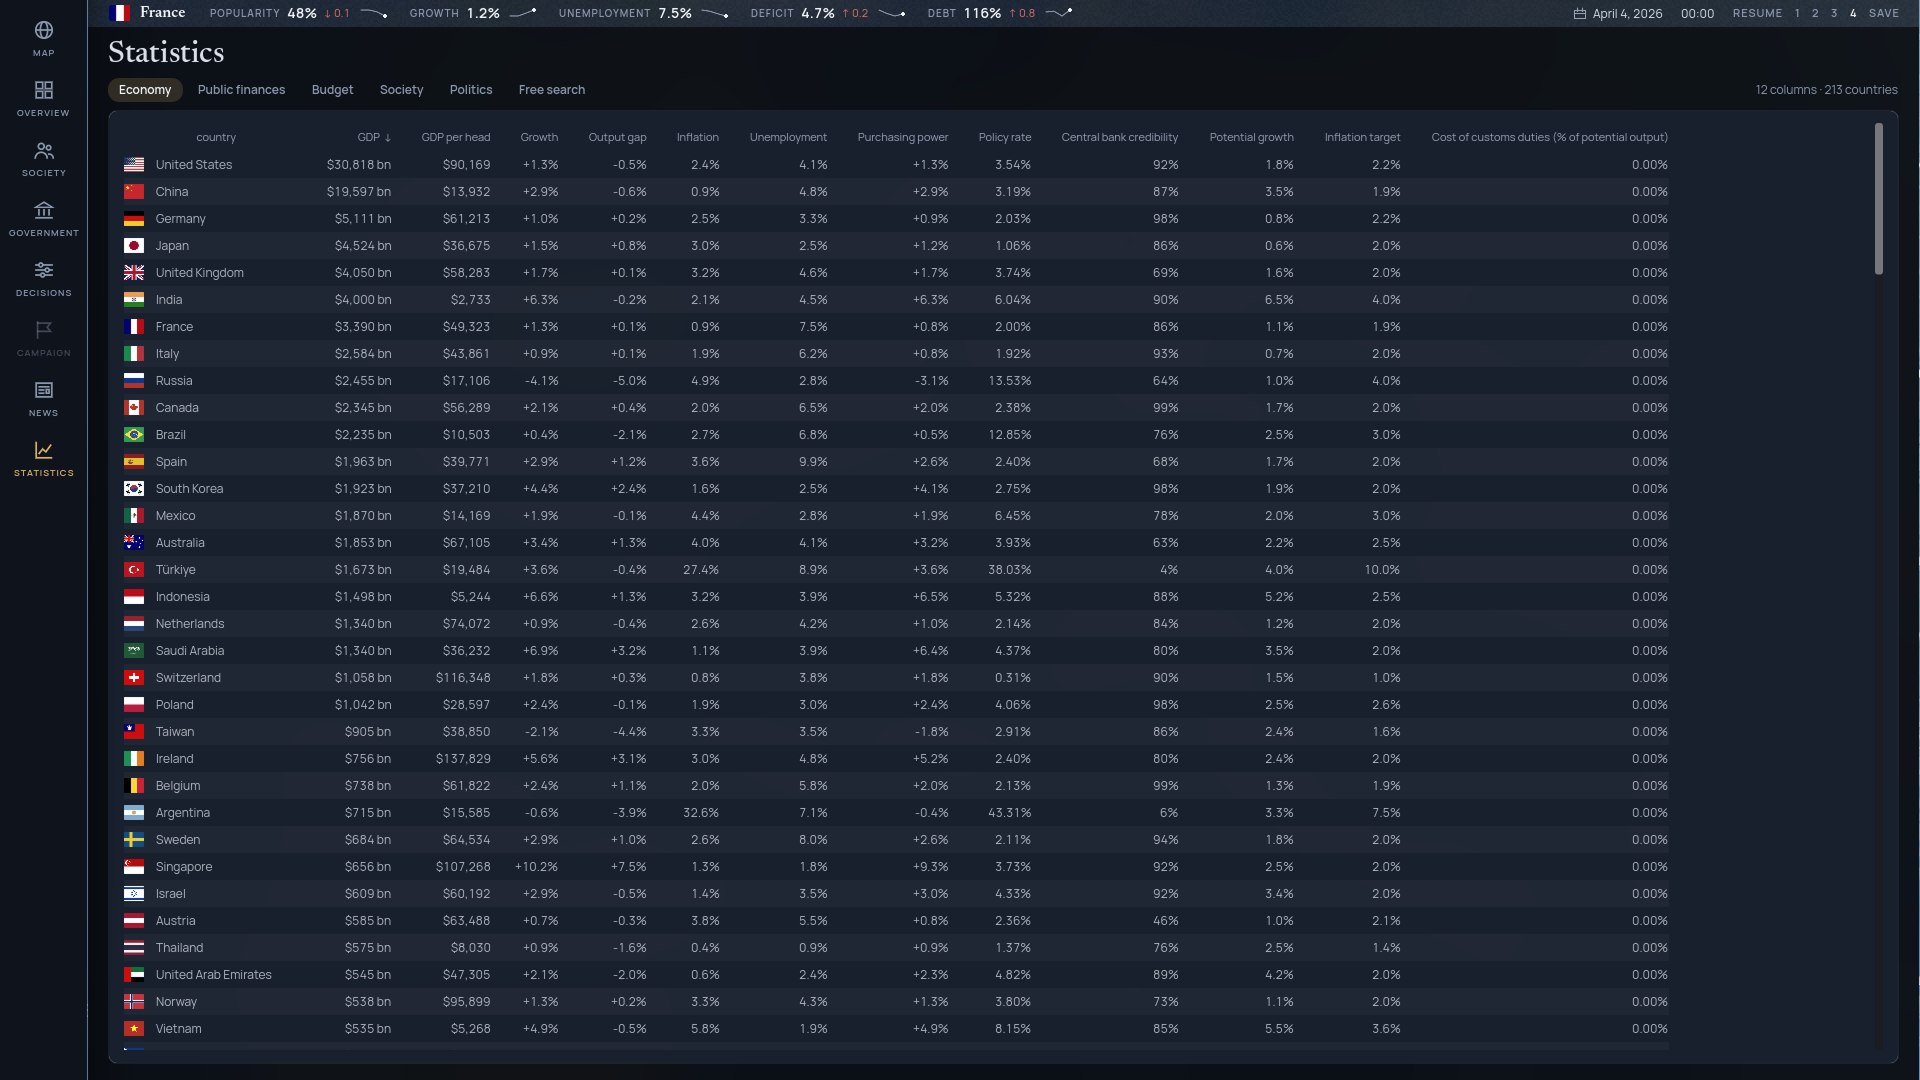
The 240 countries are compared in a single table, which sorts by any column. The tabs go from the economy to public finances, the budget, society and politics.
Countries ranked by gross domestic product, on the Economy tab.
The model
The game's economic model is published. The documentation gives its equations one by one, the value of each parameter with its source, and what each rule simplifies compared with reality.
Each page has its sliders, to make a mechanic react and see what it does before trying it in a game. The debt loop, alongside, is one example.
This lab is an example. It comes from the Debt and default page, and each mechanic of the documentation has its own.